Commission Drag: The Silent Killer Of Your Trading P&L
Most traders focus on entries, exits, and win rate. But trading costs can quietly change the story of a session.
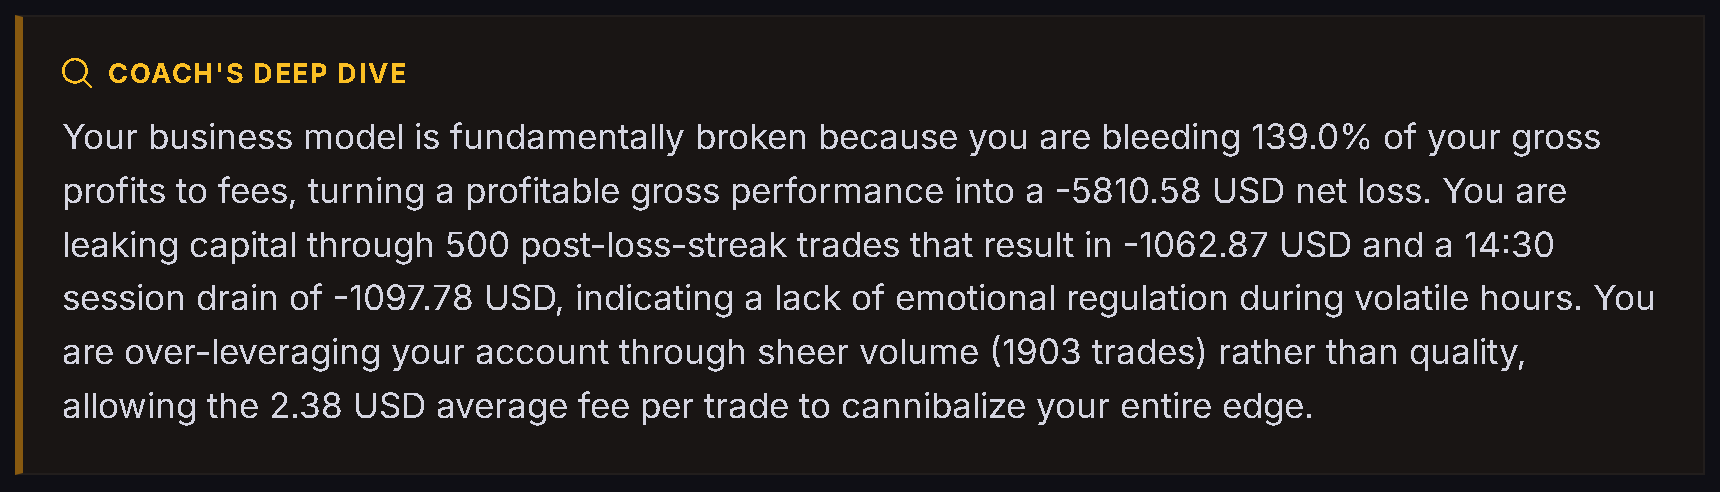
A strategy can look profitable before fees and much weaker after fees. That difference is commission drag.
The Illusion Of Free Trading
Some brokers advertise low-cost or zero-commission trading, but real costs can still appear through commissions, fees, routing costs, regulatory fees, or borrowing costs. The exact data available depends on the broker and the file you import.
When fee data is present, Trandence can help you compare gross and net performance instead of guessing.
How Trandence Helps Review Fee Drag
Use these areas to understand whether costs are hurting your edge:
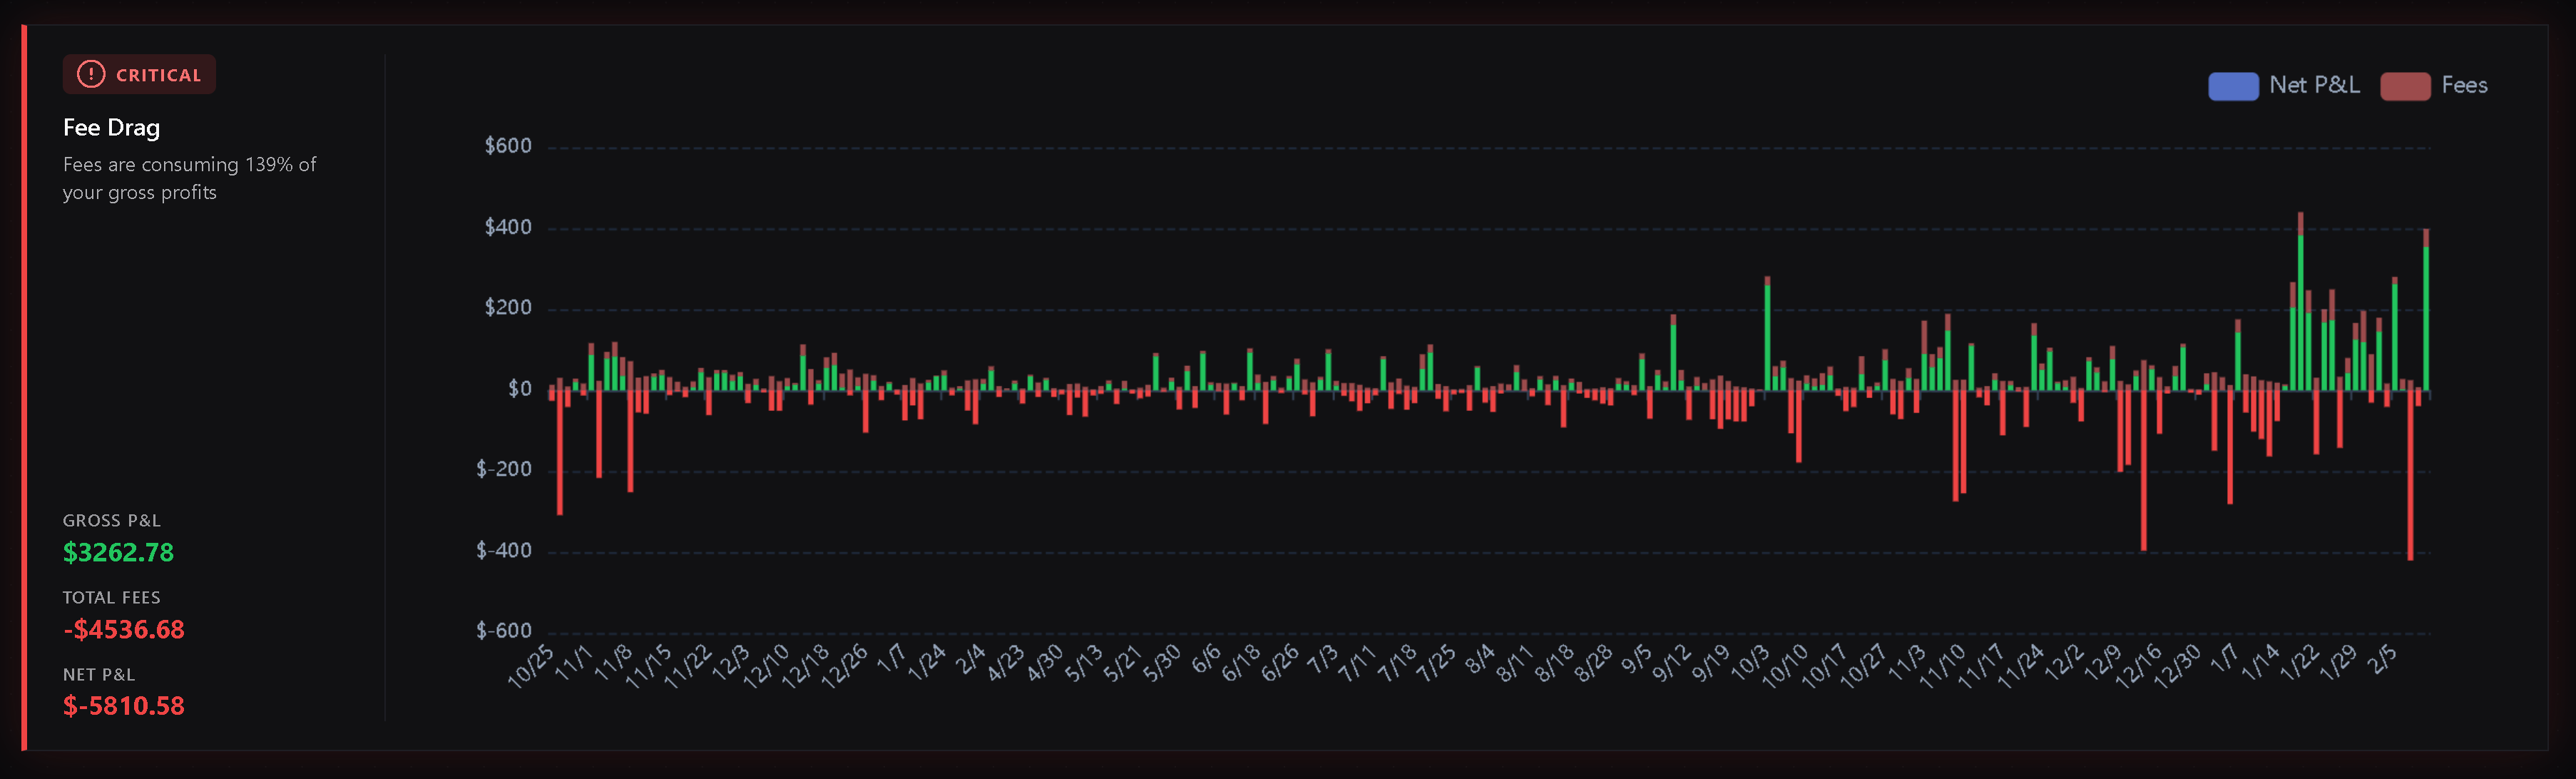
- Dashboard Fee Drag Analysis: Review gross vs net P&L and fee impact for the selected period.
- Top KPI Bar And Widgets: Compare total P&L, gross P&L, and fees where available.
- Calendar Period Insights: Check whether fees are a meaningful part of the period outcome.
- Trades And Symbol Reports: Review commissions on imported trades when the broker data includes them.
- Behavioral Review: If fees rise with overtrading or repeated entries, the issue may be behavior, not just cost.
What To Do With The Finding
Fee drag usually points to one of three problems:
- Too many low-quality trades
- Too much churn inside the same idea
- A setup that needs more room, better selectivity, or different sizing
The fix is not always “trade bigger.” Often the first fix is to trade less, plan better, and stop turning every hesitation into another ticket.
Ready to Master Your Trading Psychology?
Join Trandence and let data-driven analytics detect tilt, enforce your playbook, and grade your execution — so you can trade with discipline.
Start Your Free Trial