Beyond Candlesticks: Visual Trade Reconstruction
Reviewing trades from a table alone is difficult. You can see the P&L, but you may miss the context: where the entry happened, how price moved afterward, and whether the exit matched the plan.
Visual reconstruction helps close that gap.
Review Trades On The Chart
Trandence chart tools can show execution context alongside your trade review. Use Calendar chart tools and Symbol Reports to inspect the selected date and symbol with the context you need.
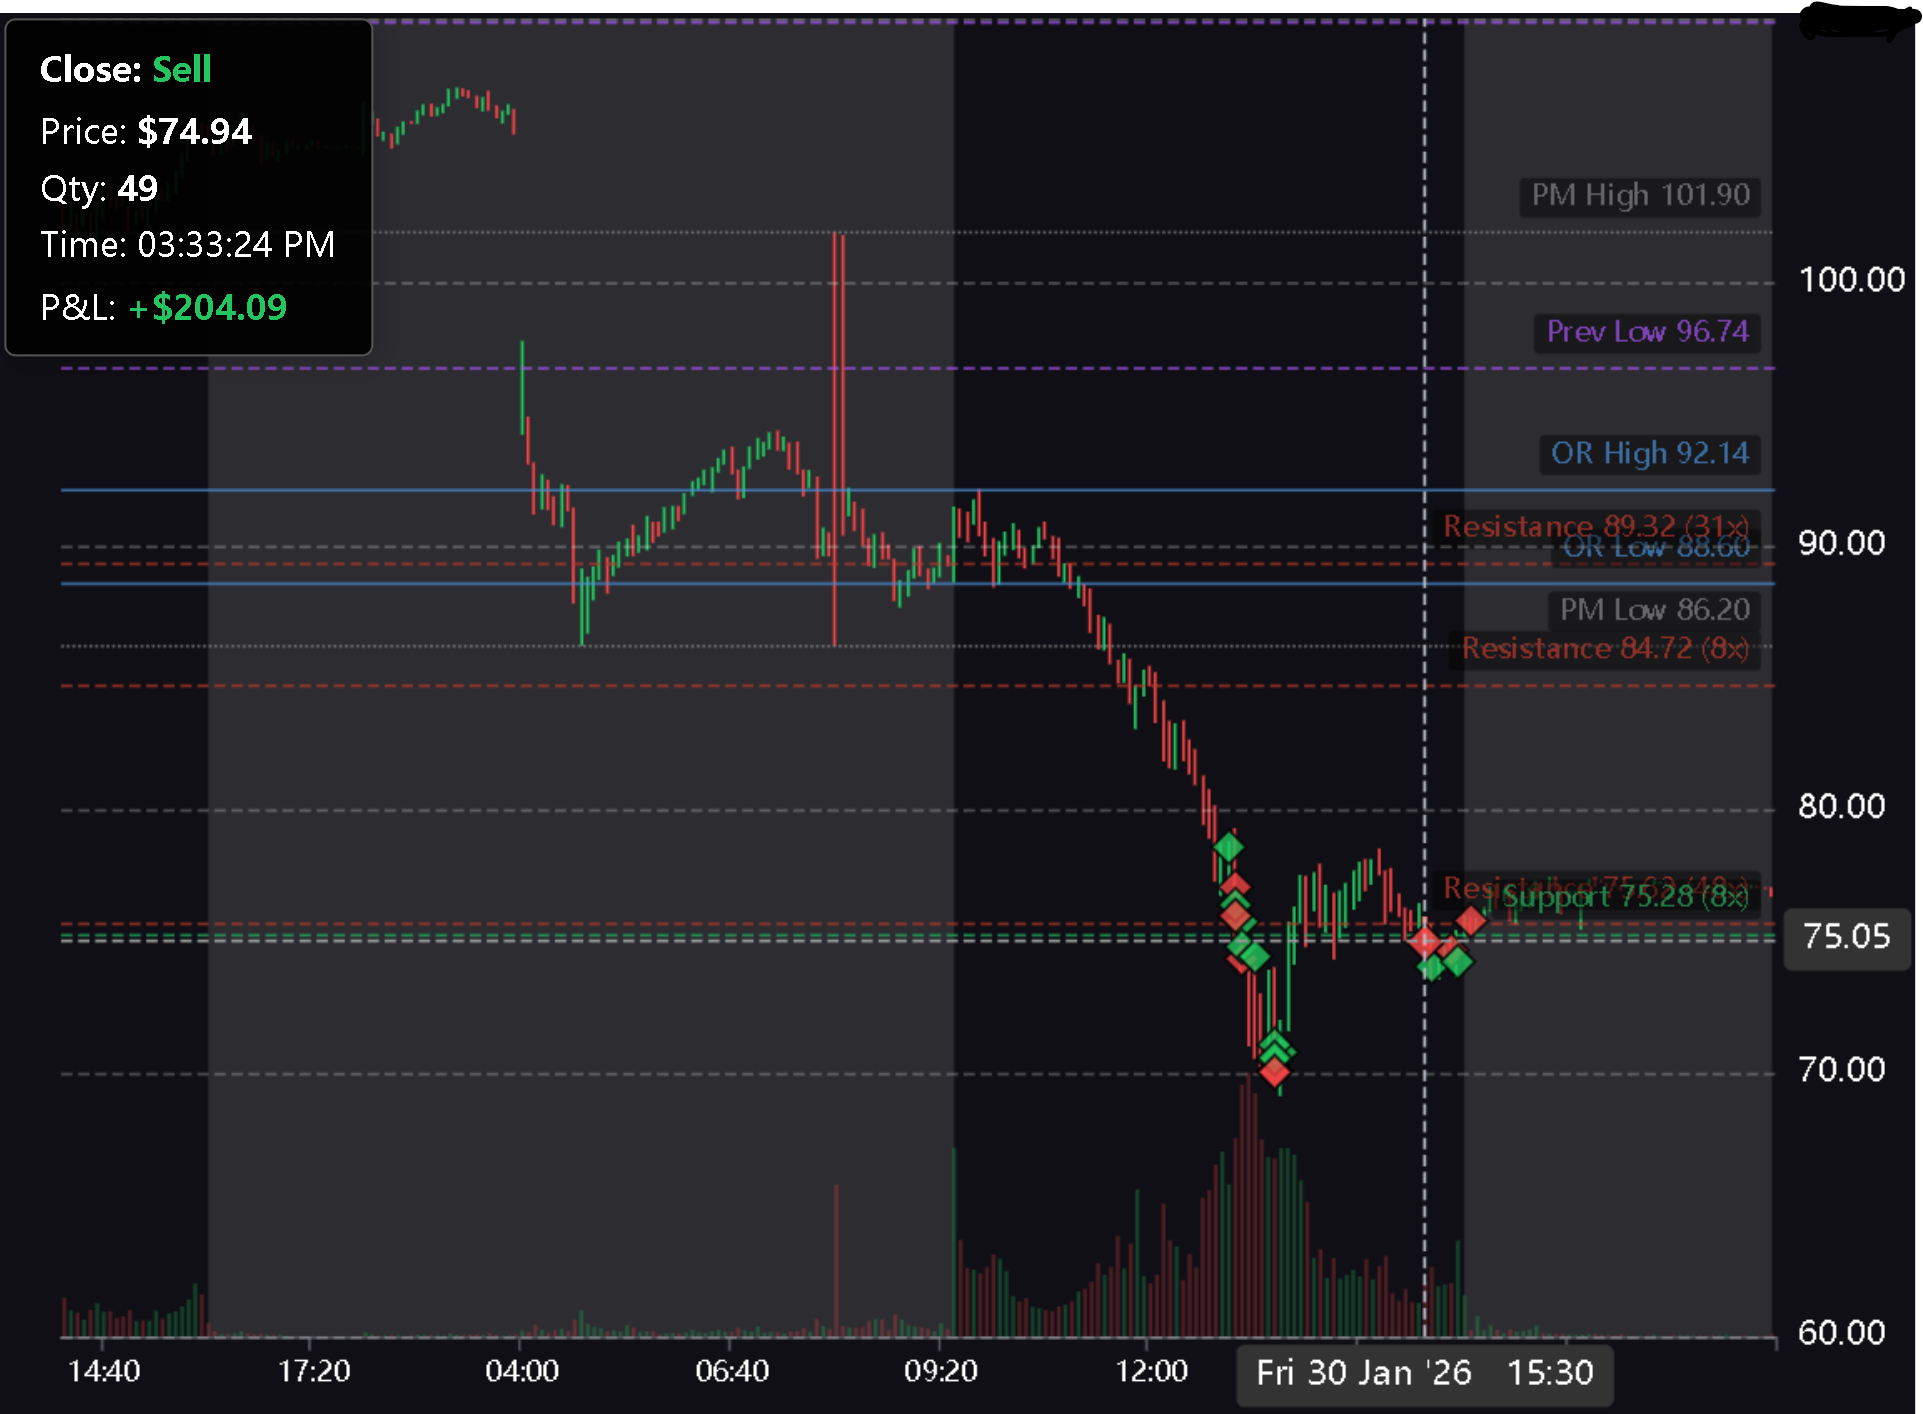
The chart review workflow can include:
- Price action around the session
- Execution markers
- Timeframe selection
- Indicators
- Drawing tools
- Saved lines
- Full-screen review
- Snapshot or export-style review
- AI chart analysis where available
Add The Levels That Matter
The most useful chart is not always the chart with the most indicators. It is the chart that shows whether the trade made sense at the time.
Use saved lines and drawing tools to mark the levels that matter to your setup:
- Premarket high and low
- Previous day high and low
- Opening range
- Planned entry area
- Planned stop area
- Target or scale-out zones
Then compare those levels with the actual execution. Did you buy into resistance? Did you exit near support? Did the trade follow the Playbook or become reactive?
Connect The Chart To The Journal
A good chart review should end in the Symbol Report. Record what happened, assign the Playbook if appropriate, update setup quality, add mistake tags, and write the reflection while the context is still fresh.
Visual reconstruction is not about making the chart look professional. It is about seeing the difference between what you planned, what you did, and what the market actually offered.
Ready to Master Your Trading Psychology?
Join Trandence and let data-driven analytics detect tilt, enforce your playbook, and grade your execution — so you can trade with discipline.
Start Your Free Trial