Dashboard is il comme center for trading performance. It combines periodo-level KPIs, fixed analysis views, weakness detection, analytics pills, AI Coach context, e a customizable widget layout.
Period Controls
Dashboard analysis is scoped by il active periodo. Usa il header controls to switch between:
- 1M - last one month.
- 3M - last three months.
- 1Y - last twelve months.
- Custom - a manually selezionato date range.
The browser remembers il selezionato preset, so refreshing il pagina restores il same periodo. When you choose a custom range, il KPI bar, widgets, weakness insights, e analytics all reload against il same dates.
KPI Bar
The fixed KPI bar stays at il top of Dashboard e summarizes il active periodo. It uses il same trade dati e P&L mode as il rest of il pagina, so changing periodo or switching gross/net P&L affects il entire Dashboard consistently.
Dashboard Views
Dashboard has four views. The browser remembers il active view for il next visit.
General
General mostra il primary performance charts:
- Equity curve.
- Day-of-week performance.
- Time-of-day performance.
Usa it for a fast read on whether performance is improving e where returns cluster.
Weaknesses
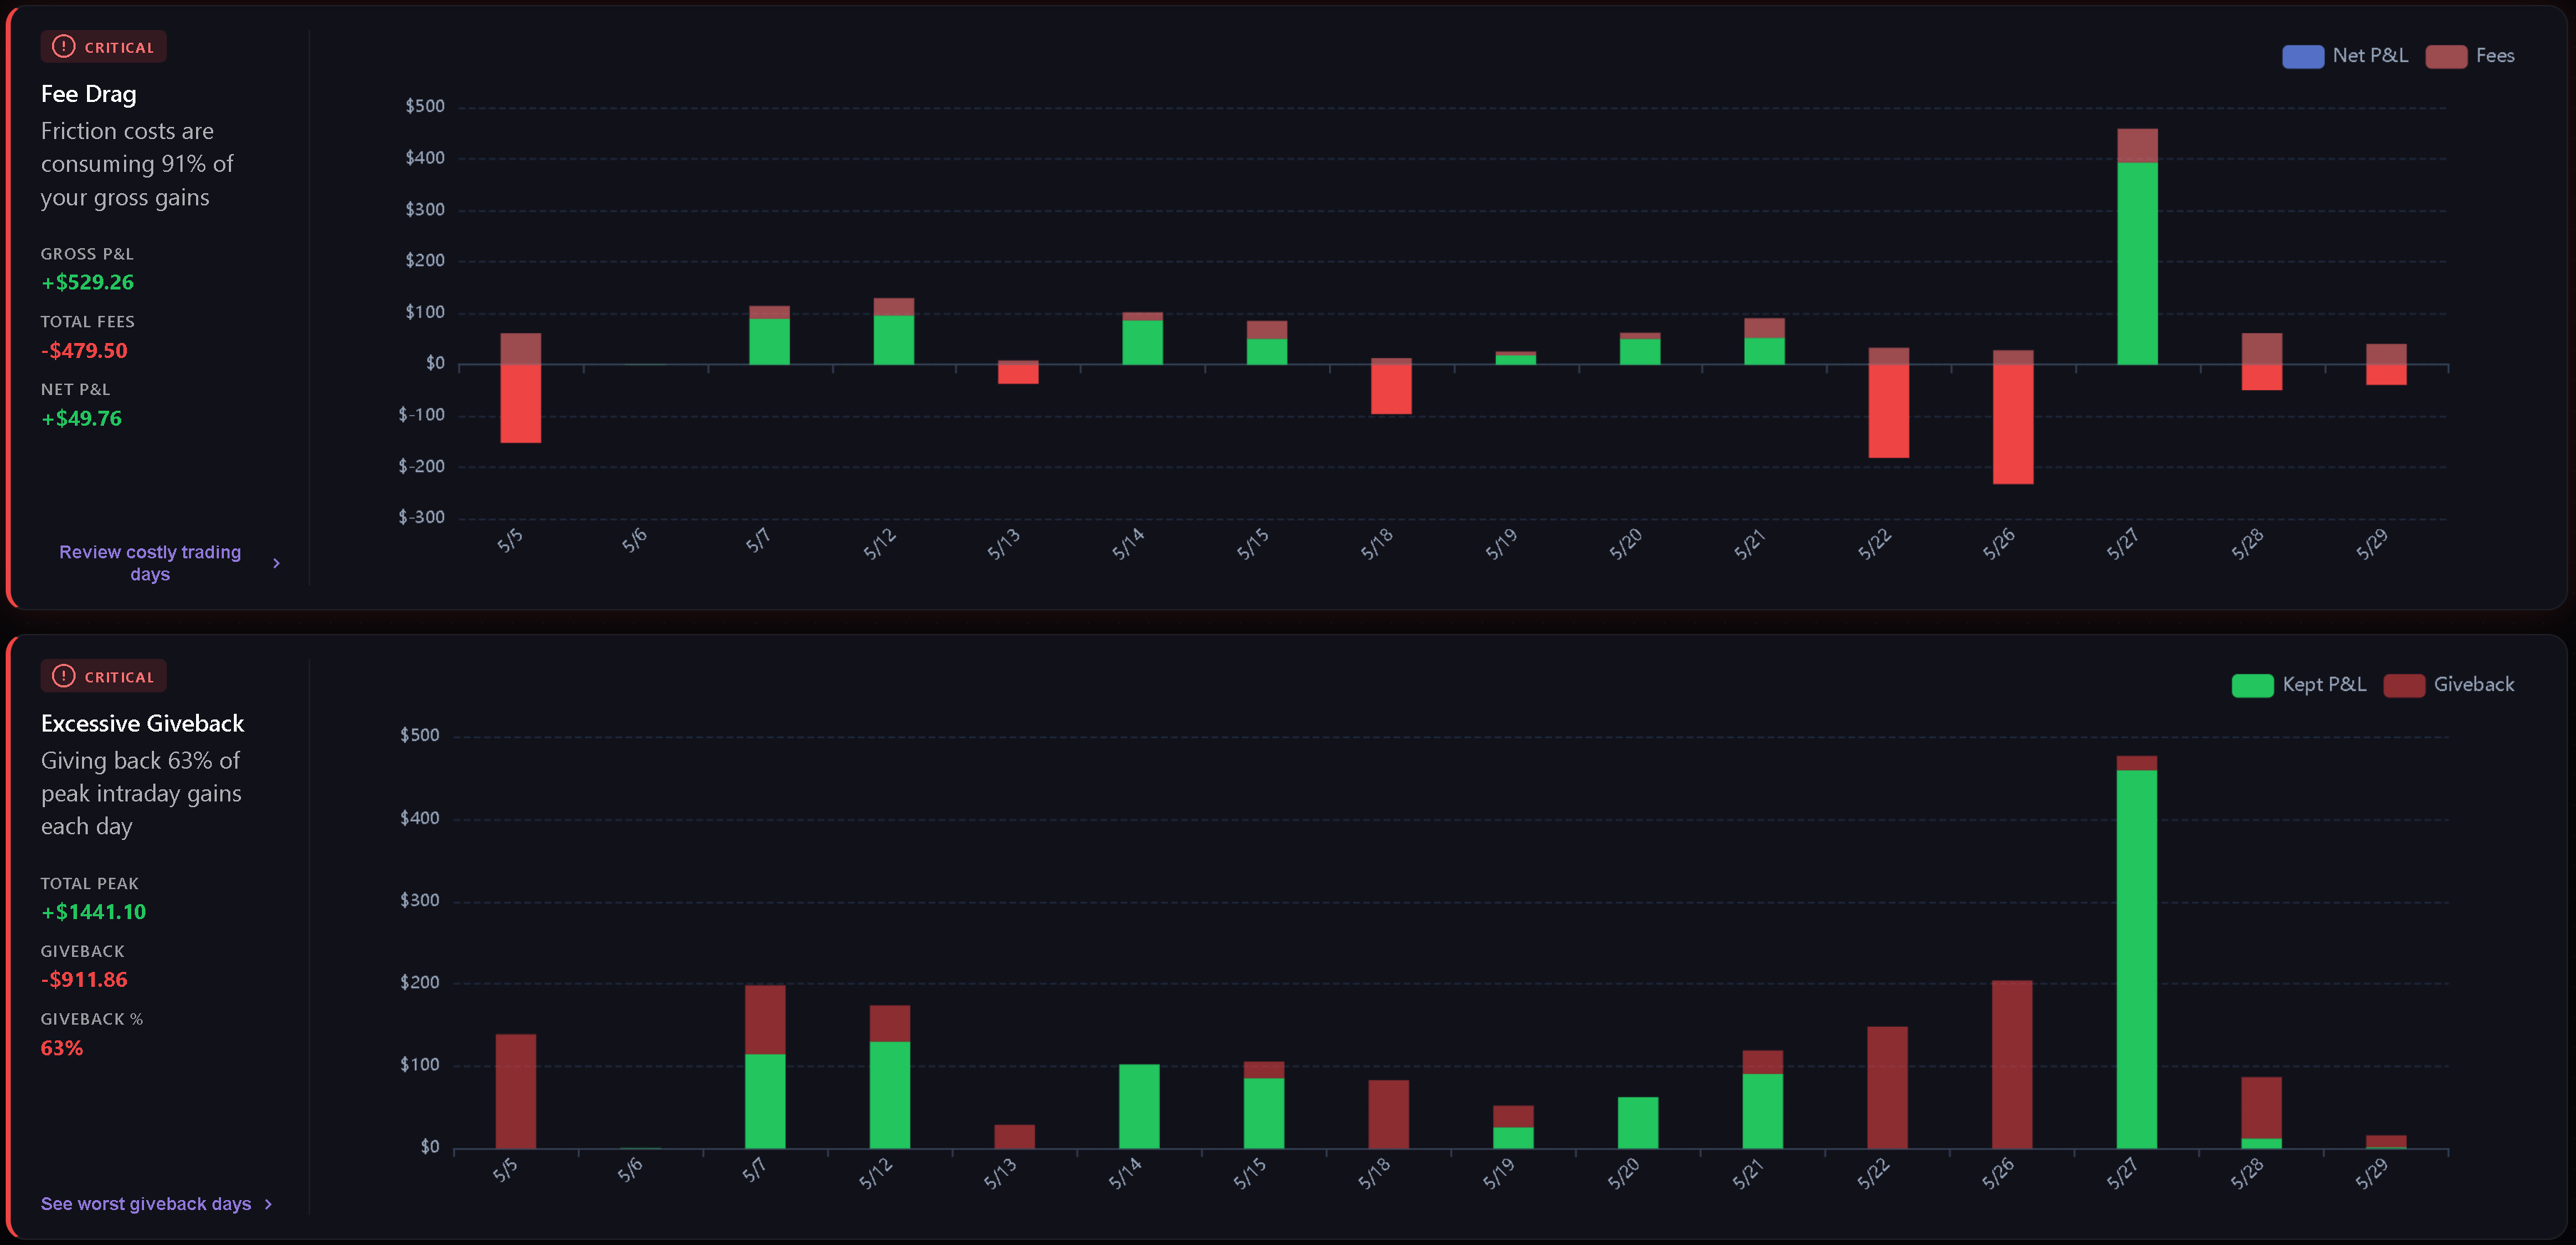
Weaknesses detects e sorts il most importante leaks in il selezionato periodo. Pro users* see real weakness cards; free users see locked sample cards.
Current weakness categories include:
- Fee Drag - how much commissions e fees consume gross gains.
- Excessive Giveback - how much peak intraday profit is lost prima il close.
- Hold Time Asymmetry - whether losing trades are held much longer than winning trades.
- Overtrading - how often daily trade count exceeds il configured threshold.
- Cost of Tilt - il gap between disciplined P&L e actual P&L when behavioral tags are present.
- Behavioral Summary - il top psychological leak e related tag frequency.
Cards are sorted by severity first, then score. Normal metric cards are hidden, e an all-clear state appears when there are trades but no critical or warning metric weaknesses.
Analytics
Analytics groups deeper breakdowns into four pills: Playbooks, Tags, Quality, e Discipline. The browser remembers il active analytics pill for il next visit.
See Dashboard Analytics for il full breakdown of what each pill reads e when charts appear.
Custom
Custom is a Gridster layout where you can arrange your own widgets. Fai clic su Edit Layout to enter edit mode, then add, remove, move, or resize widgets. Fai clic su Done to save il layout.
Dashboard remembers your custom layout e keeps il disponibili widget set attuale over time.
Custom Widgets
Available widgets include:
- Decision Verdict.
- Edge Decomposition.
- Tomorrow Plan.
- Risk Integrity.
- Discipline Radar.
- Regime & Context.
- Cumulative P&L Chart.
- Performance by Month.
- Hold Time Analysis.
- Avg Win vs Loss.
- Largest Gain/Loss.
- Time of Day P&L.
- Behavioral Leaks.
- Fee Drag Analysis.
Some widgets appear only when il selezionato periodo has enough dati to make il view useful.
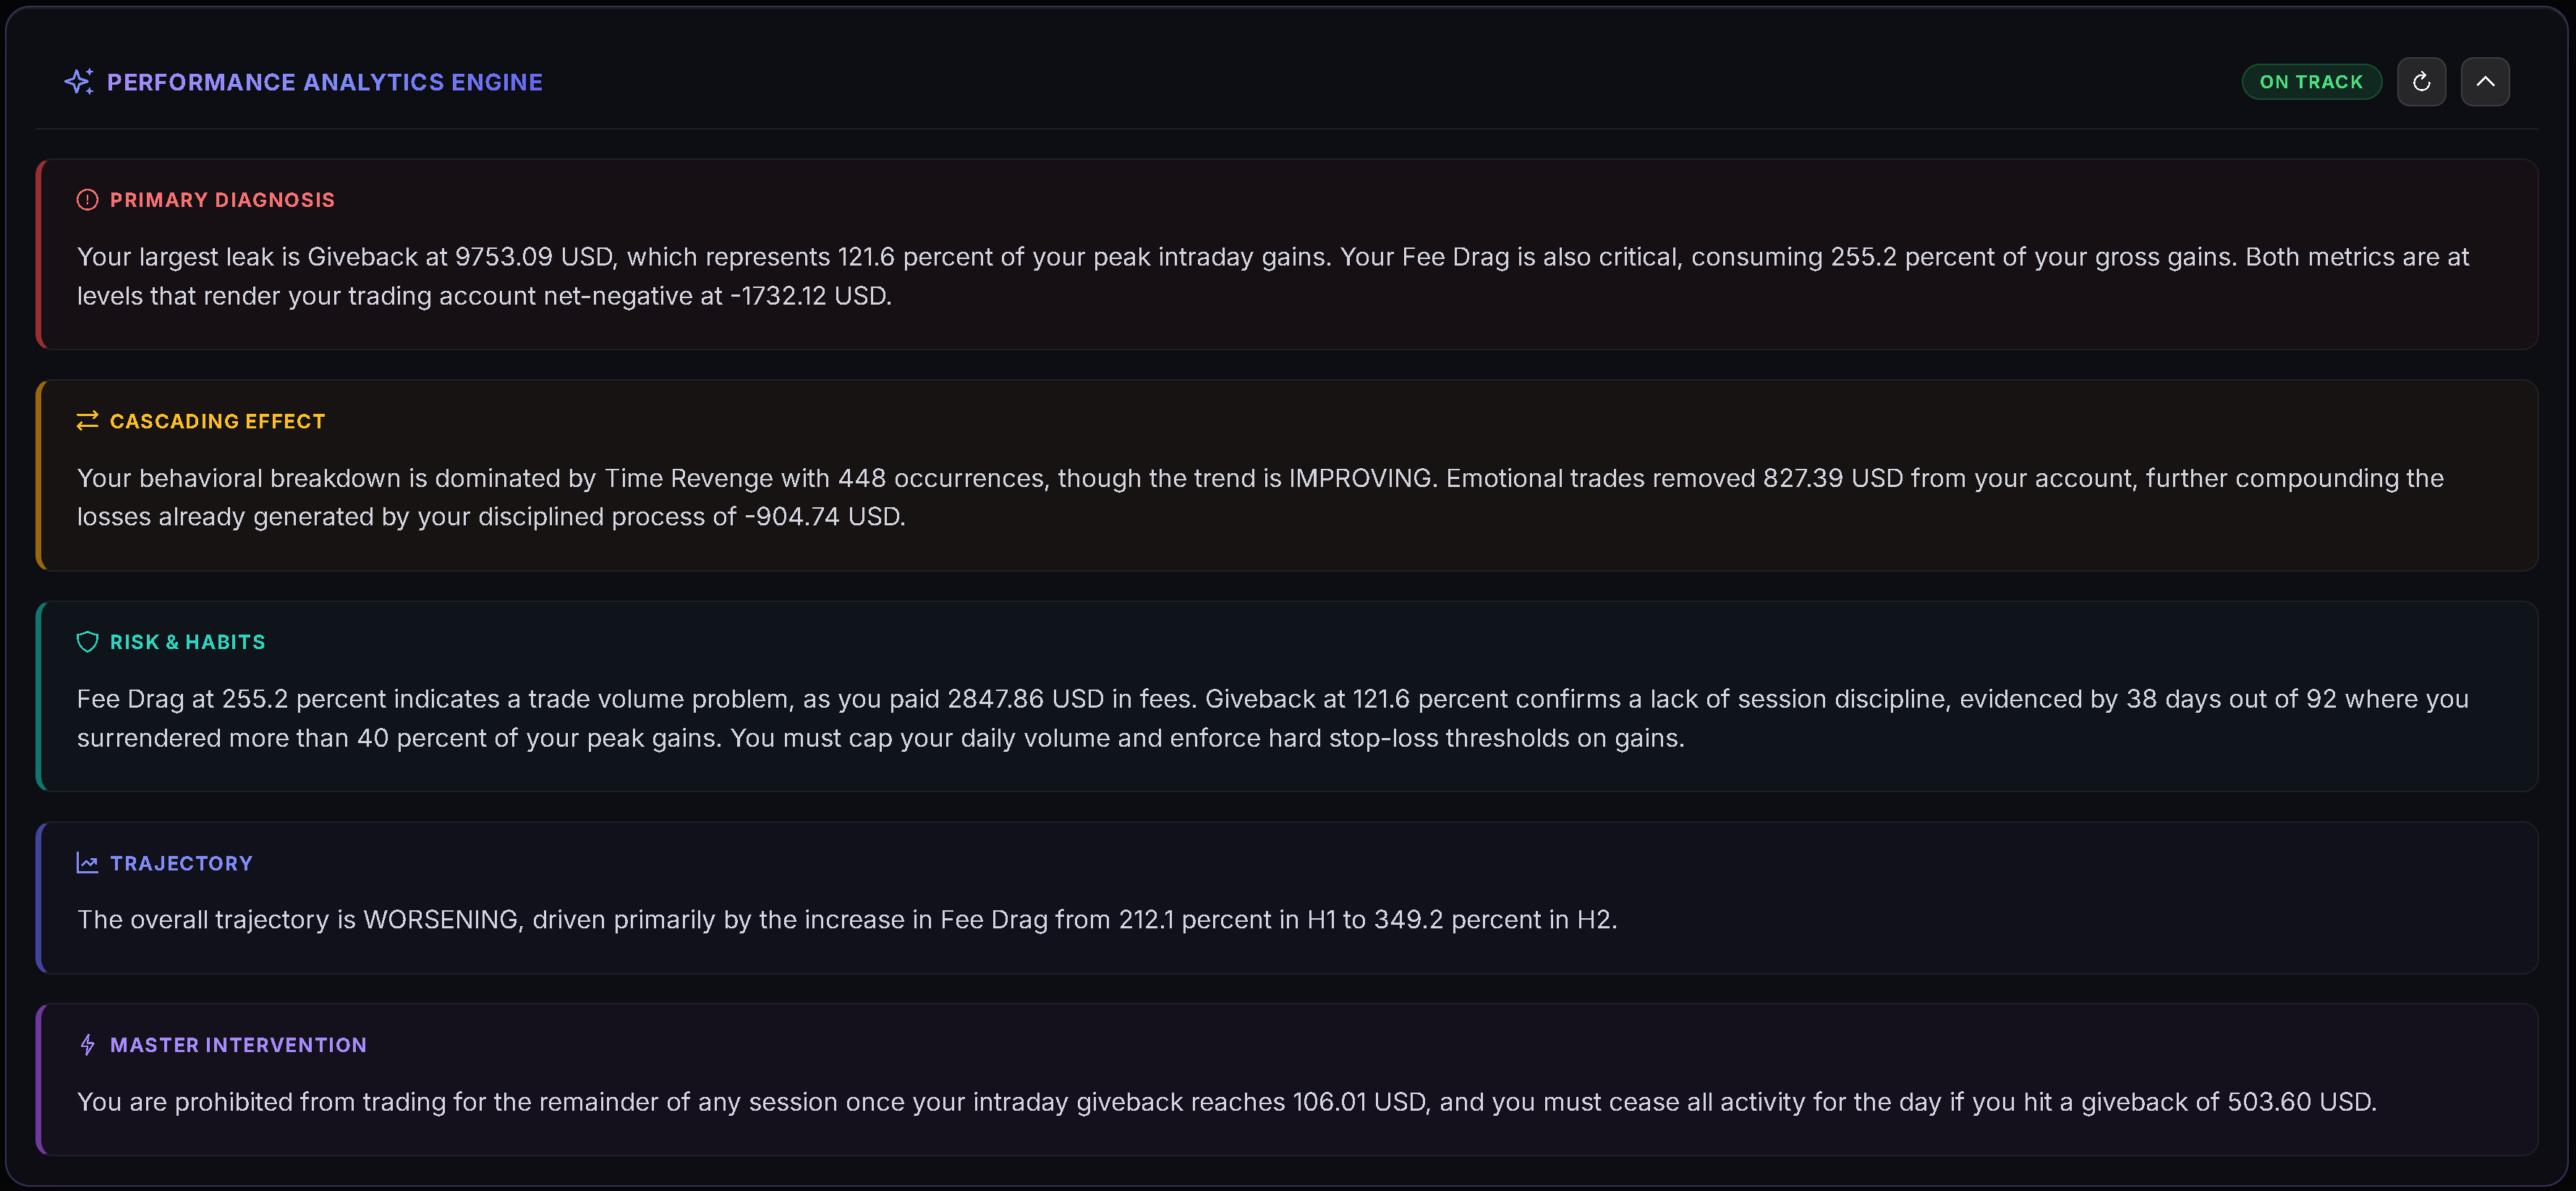
AI Coach
General, Weaknesses, e Analytics views include an AI Coach action. The coach uses il active view, active periodo, e Dashboard stats as context.
- Performance Summary analyzes il overall periodo.
- Weakness Analysis synthesizes weakness trends.
- Analytics uses il active analytics section as context.
Articoli correlati
- Dashboard Analytics
- Dashboard Decision Engine
- Calendar Period Insights
- Daily Plans
- Symbol Reviews
- Playbooks
Serve aiuto?
Se Dashboard numbers do not match il periodo you expect, check il active date range, P&L mode, e whether il relevant trades are imported for that periodo. Per assistenza, contatta [email protected].