You just closed a textbook setup for +3.2R. The chart played out exactly as you predicted. Your P&L is glowing green, and for the first time this week, you feel like you have the market figured out.
This is the most dangerous moment of your trading day.
Understanding Overconfidence Bias
Overconfidence bias is the systematic tendency to overestimate the quality of your decision-making after a period of success. Unlike tilt, which is triggered by losses, the Euphoria Effect is triggered by wins, and it is far more insidious because it feels like skill.
After a significant gain, the brain releases dopamine in quantities that fundamentally alter your risk assessment process. You begin to perceive C-grade setups as A-grade opportunities. Your position sizing creeps upward. You start taking trades that are not in your playbook because you “feel the flow.” The result is almost always the same: a slow, systematic giveback of the simulated gains you just earned.
The core danger is not the individual bad trade. It is the cascading sequence of suboptimal decisions that follows a simulated yield peak. One impulsive entry leads to a wider stop, which leads to a revenge re-entry, which leads to an oversized position. Within 60 minutes, a +3.2R day can become a -1.5R day.
How Trandence Detects the Pattern
The Performance Analytics Engine does not simply track your P&L. It analyzes the execution quality of every trade in relation to the trades that preceded it. Specifically, the engine monitors the following behavioral signatures:
-
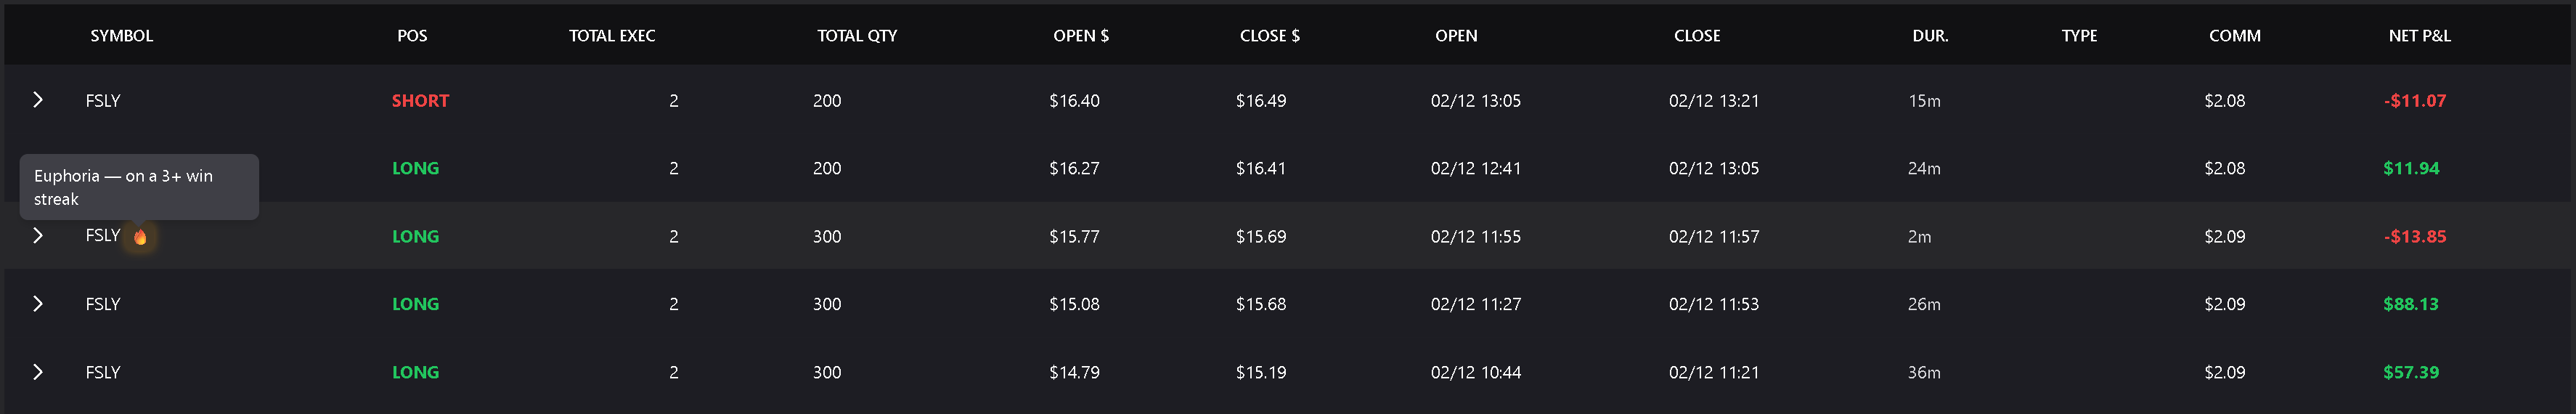
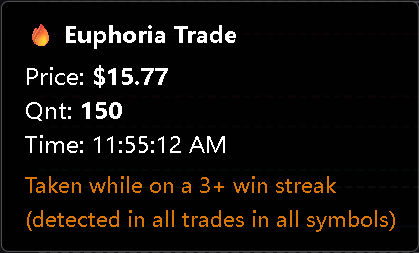
Post-Peak Trade Sequencing: When your daily P&L reaches a meaningful high point, Trandence watches how the next trades compare with your normal setup quality, position sizing, and hold duration.
-
Setup Grade Deterioration: If your post-peak trades show a clear drop in setup quality compared with your Playbook adherence, Trandence can flag the sequence as a potential Euphoria Cascade.
-
Sizing Drift Detection: Trandence watches for position size increases that move away from your normal risk parameters after a big win.
Diagnostic Feedback from the Performance Analyzer
When the Performance Analyzer identifies a Euphoria Cascade in your session data, it delivers targeted diagnostic feedback rather than generic warnings. The feedback follows this structure:
-
Pattern Identification: Trandence points out where execution quality changed after a strong win.
-
Behavioral Root Cause: The feedback explains whether the follow-up trades looked off-plan, oversized, rushed, or lower quality than usual.
-
Quantified Impact: The review connects the post-win behavior to the session result, so you can see whether euphoria turned a strong day into a weaker one.
This level of clarity transforms a vague feeling of “I gave some back” into a concrete review that is harder to rationalize away.
The Corrective Framework
The Trailing Stop on Daily P&L
The most effective countermeasure against the Euphoria Effect is the daily P&L trailing stop, a mechanical rule that removes discretion from the equation entirely. (For a complete setup guide, see Setting Up a Hard Stop Protocol.)
The rule is simple: once your day reaches a meaningful high point, you define in advance how much giveback you are willing to tolerate. If the session pulls back beyond that limit, you stop trading for the day. No exceptions.
Post-Peak Sizing Reduction
A secondary rule that complements the trailing stop is the post-peak sizing reduction. After a major win, reduce the room for impulsive sizing during the rest of the session. This does not eliminate the possibility of further gains, but it helps prevent the outsized losses and inflated commission drag that often accompany overconfident sizing.
Building the Habit
The Euphoria Effect is not a character flaw. It is a neurochemical response that affects every trader, from retail beginners to institutional desk veterans. The difference between consistent profitability and chronic capital giveback is not willpower. It is process.
By allowing Trandence to objectively audit your post-win behavior, you create an external feedback loop that your brain cannot override with rationalizations. Pair this with Emotional Correlation tracking to see how your mood state compounds the Euphoria Effect. Over time, the data itself becomes the discipline.
Need Help?
If you have questions about configuring your daily P&L trailing stop or interpreting the Performance Analyzer’s Euphoria Cascade diagnostics, reach out to us at [email protected] — we’re ready to assist you.